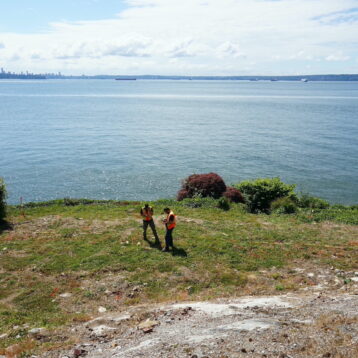
At a new utility installation in Vancouver Island, the client needed information about the depth of the bedrock to reduce the price of the project. By utilizing Electrical Resistivity Tomography (ERT) and Ground Penetrating Radar (GPR) simultaneously, GeoScan successfully located, mapped and profiled the bedrock below the proposed line.
Situation
Shallow bedrock creates an issue for utility installations as it can dramatically increase the overall price of a project. By having information of the depth of the bedrock along the route of the installation, estimations can be made of where and how much blasting, or excavation of the bedrock is necessary on the proposed line. Furthermore, mapping the bedrock can also provide potential alternative routes for the proposed utility.
Boreholes are very accurate way of mapping the stratigraphy, but they provide very localized (point) information. GeoScan’s bedrock profiling methods have the advantage of creating a literally continuous profile (or a 3 dimensional surface) of the subsurface layers and is able to “connect” borehole results to create the most accurate model of the underground.
Solution
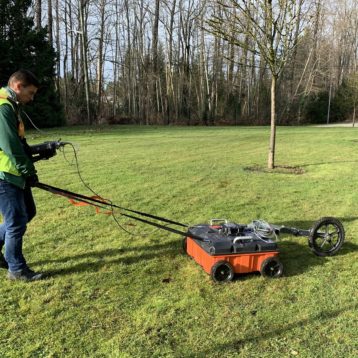
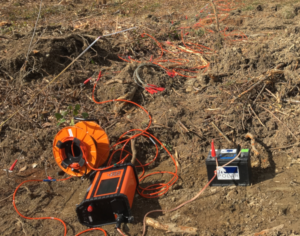
GeoScan was hired to utilize shallow geophysical survey methods to accomplish the task. The survey area had a rough terrain and it had just been cleared from vegetation, which was a limiting factor when choosing the most appropriate method for the survey.
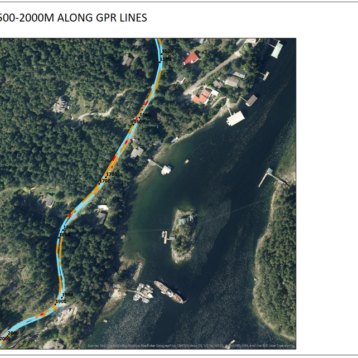
Our approach to a problem is always complex. We know that answering a question about the shallow subsurface has several factors to take into account. In this particular case, the rough terrain was a limiting factor to collect a long GPR profile along the proposed line. Instead, we used Electrical Resistivity Tomography (ERT) -which can be carried out at almost any terrain conditions- to collect data along the utility path. Furthermore, we collected several cross-sectional GPR line wherever the conditions allowed us to do so. We used these cross-sections to verify our ERT results and created a quasi 3 dimensional surface profile of the bedrock along and around the proposed trench line.
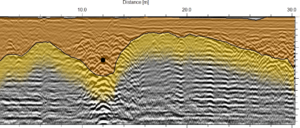
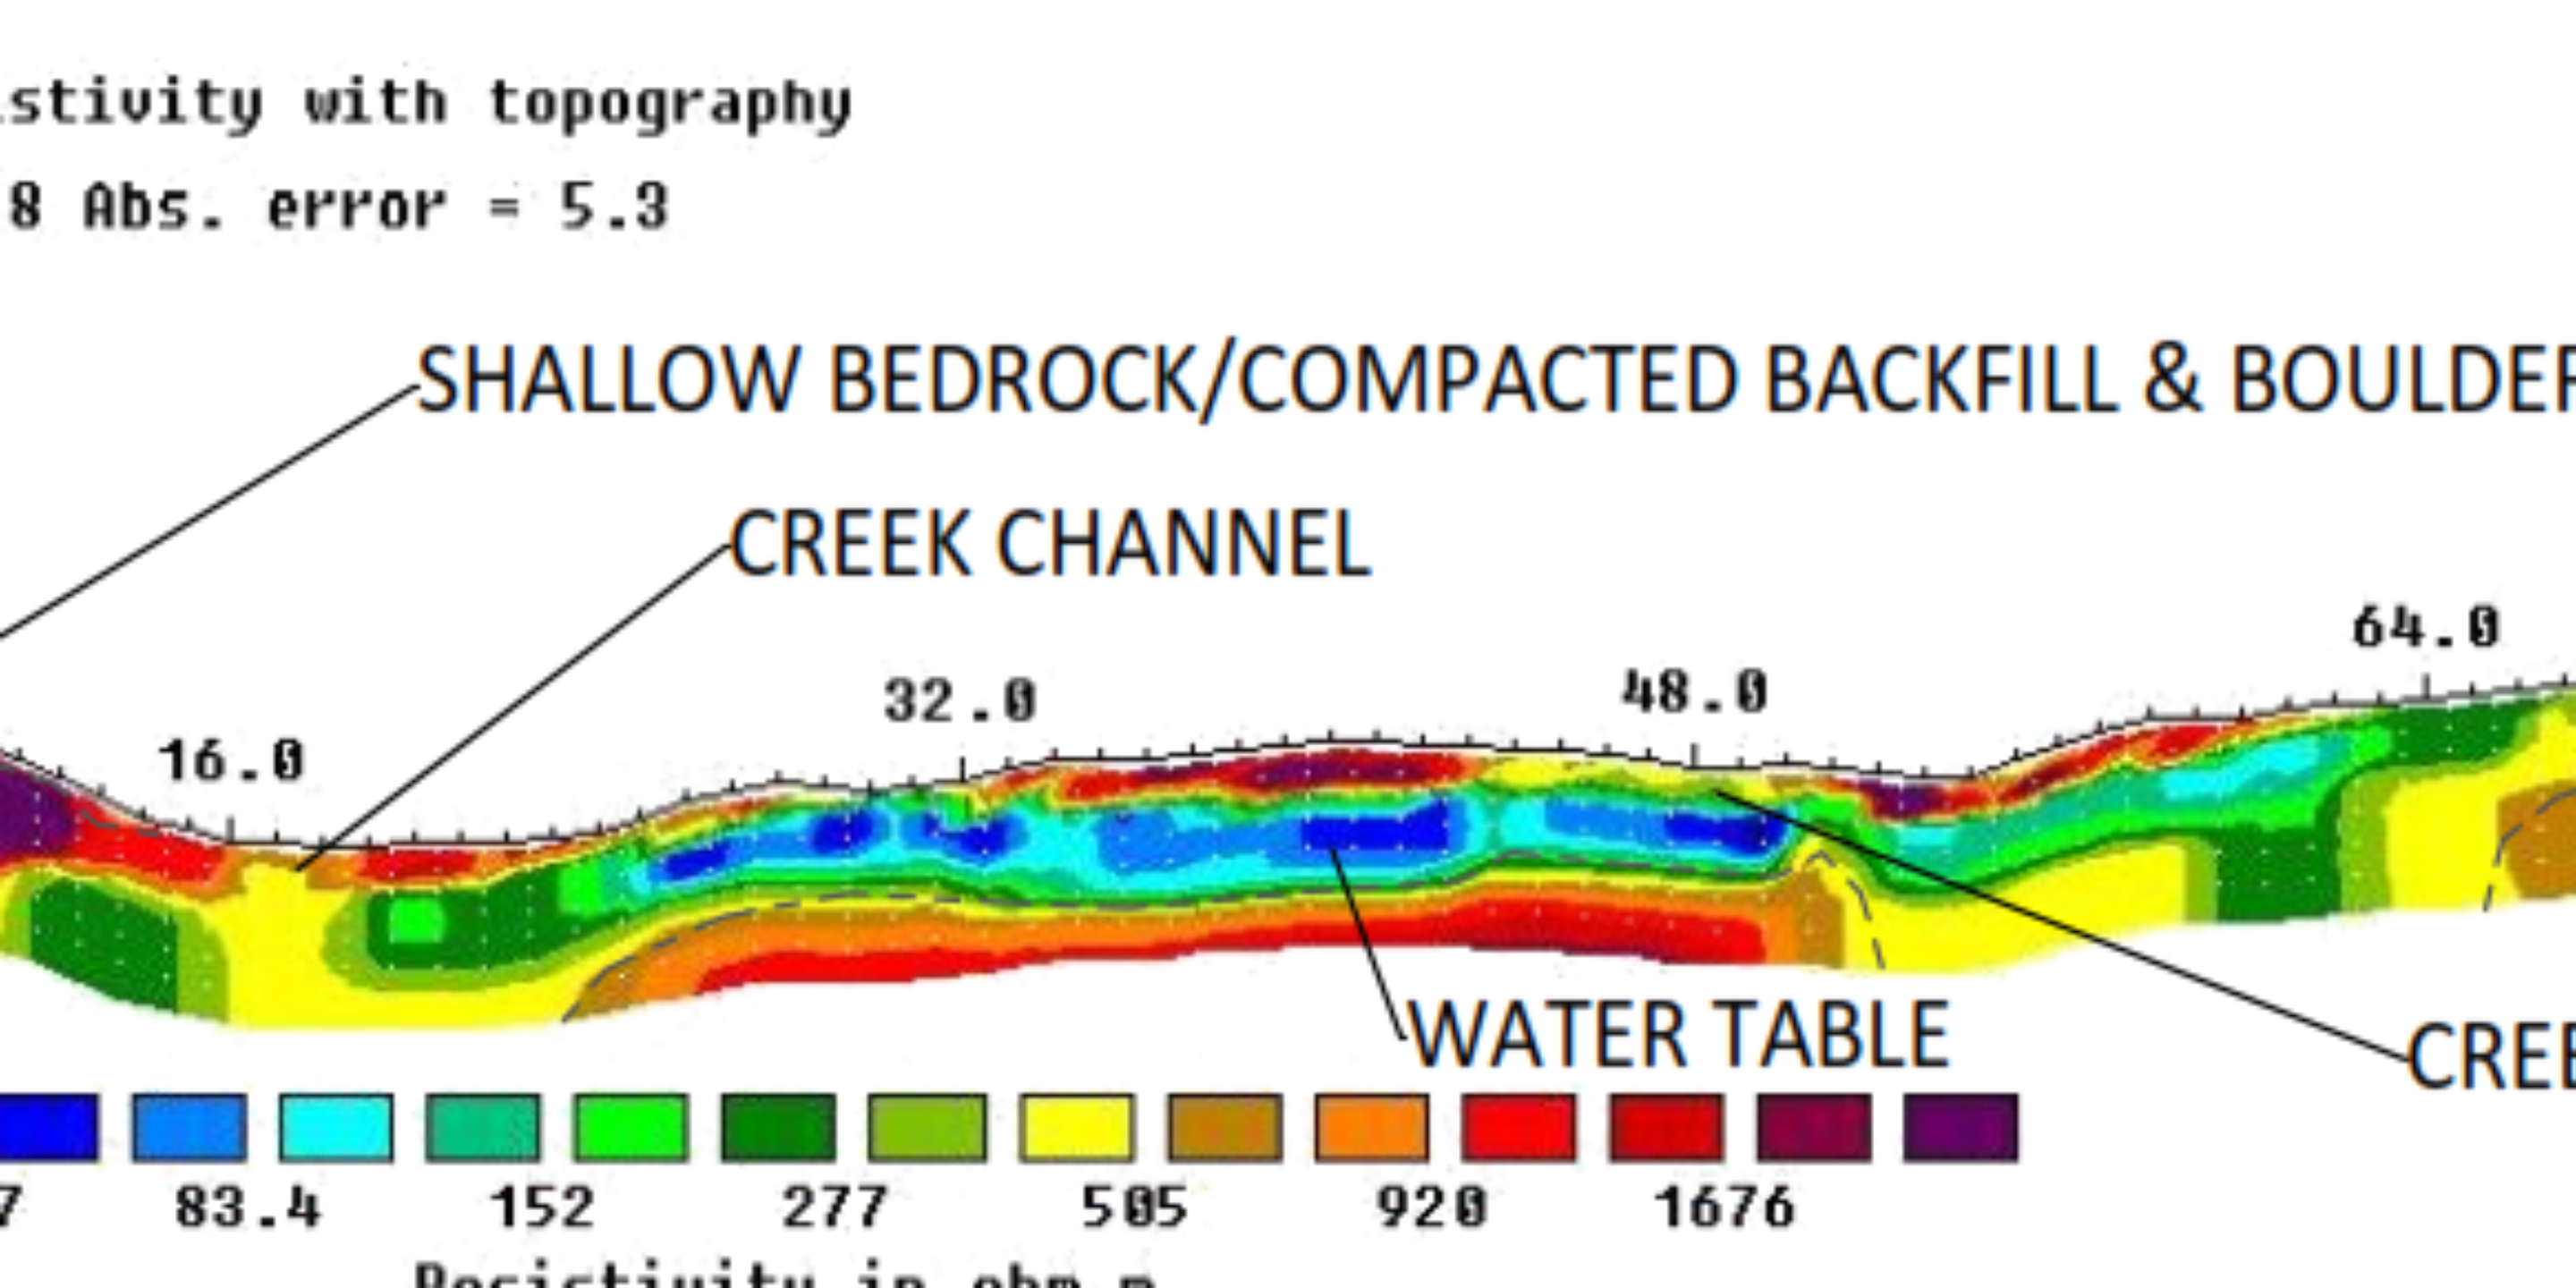
A processed and interpreted GPR cross section is displayed above. This particular line shows the profile of the bedrock (marked with yellow) and an existing utility (marked with a black dot). Around this existing pipe, the previous trench line can be picked up easily.